Skip to Main Content

Tableau
What to expect today
Today we will look to introduce Tableau and learn:
- What is Tableau? What are its strengths and weaknesses?
- How to upload data into Tableau
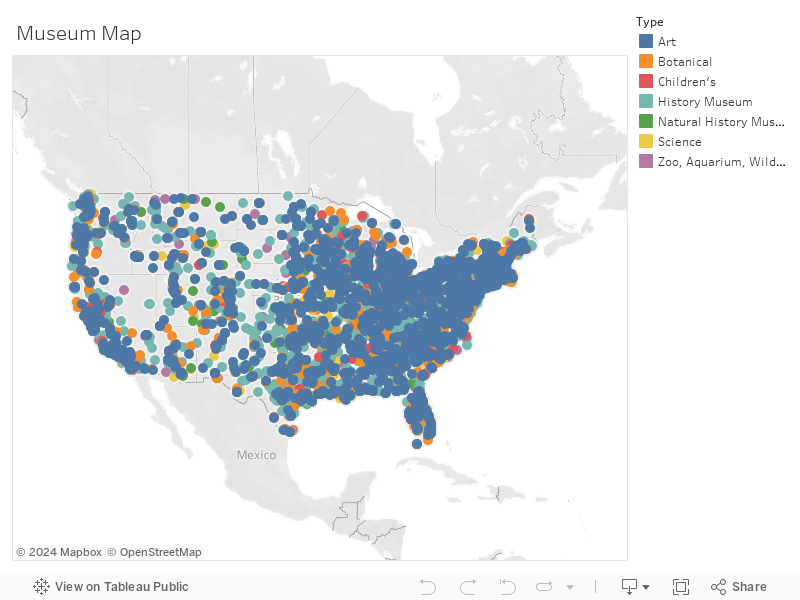
- How to build basic categorical and geographical visualization in a worksheet
- How to build a dashboard
- How to publish and share Tableau Public dashboards
What is Tableau?
Tableau is a data visualization software used for data science and business intelligence. Tableau can create a wide range of different visualization to interactively present the data and showcase insights.
What are Tableau's strengths?
- Beautiful visualizations - Tableau is first and foremost a visualization tool
- Visualization are relatively easy to build and interactive
- Tableau is easy to implement. Just create an account and download the desktop version
- Tableau has been a leader in a crowded space for some time. Their success in this arena adds value to any skill learned
What are Tableau's disadvantages?
- Limited pre-processing of data in the program. It is best to get your data straight before bringing it into the program
- Non-public version is quite expensive. However, they do offer free semester-long licenses for use of the full product in the classroom